
The tools and process we use to analyze and visualize data sometimes produce novel, aesthetically pleasing imagery. Data is a much Art as it is Science in my eyes. These series are my explorations of creating pieces of digital art by exploring real data sets with the tools of a data scientist. See what you think…
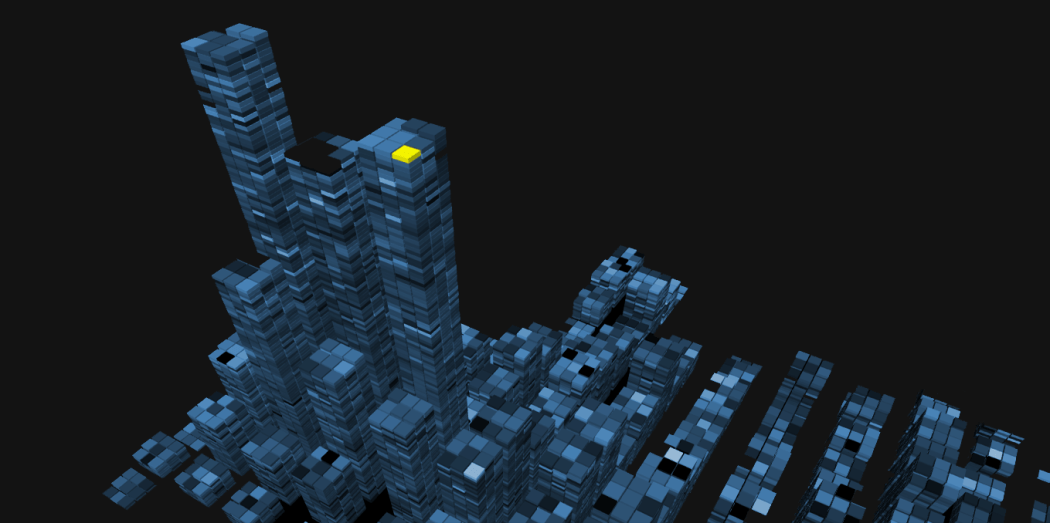
“The Outlier”
“Datascapers”
2016
This artwork series “Datascrapers” was inspired by using the experimental data explorer called “SandDance” from The Microsoft Garage, and by the skyscrapers of my beloved NYC.
All of the individual cubes within the Datascraper shapes are single data points from the same data set. These images are actual data visualizations of that real data set, interpreted as art. The colors and perspectives are all from exploring the data within SandDance. The concepts represented are partially from the world of data science mixed with the architecture of the city.
First in a continuing series, you can explore larger versions of the pieces below by just touching any of them, or checkout this PDF gallery.

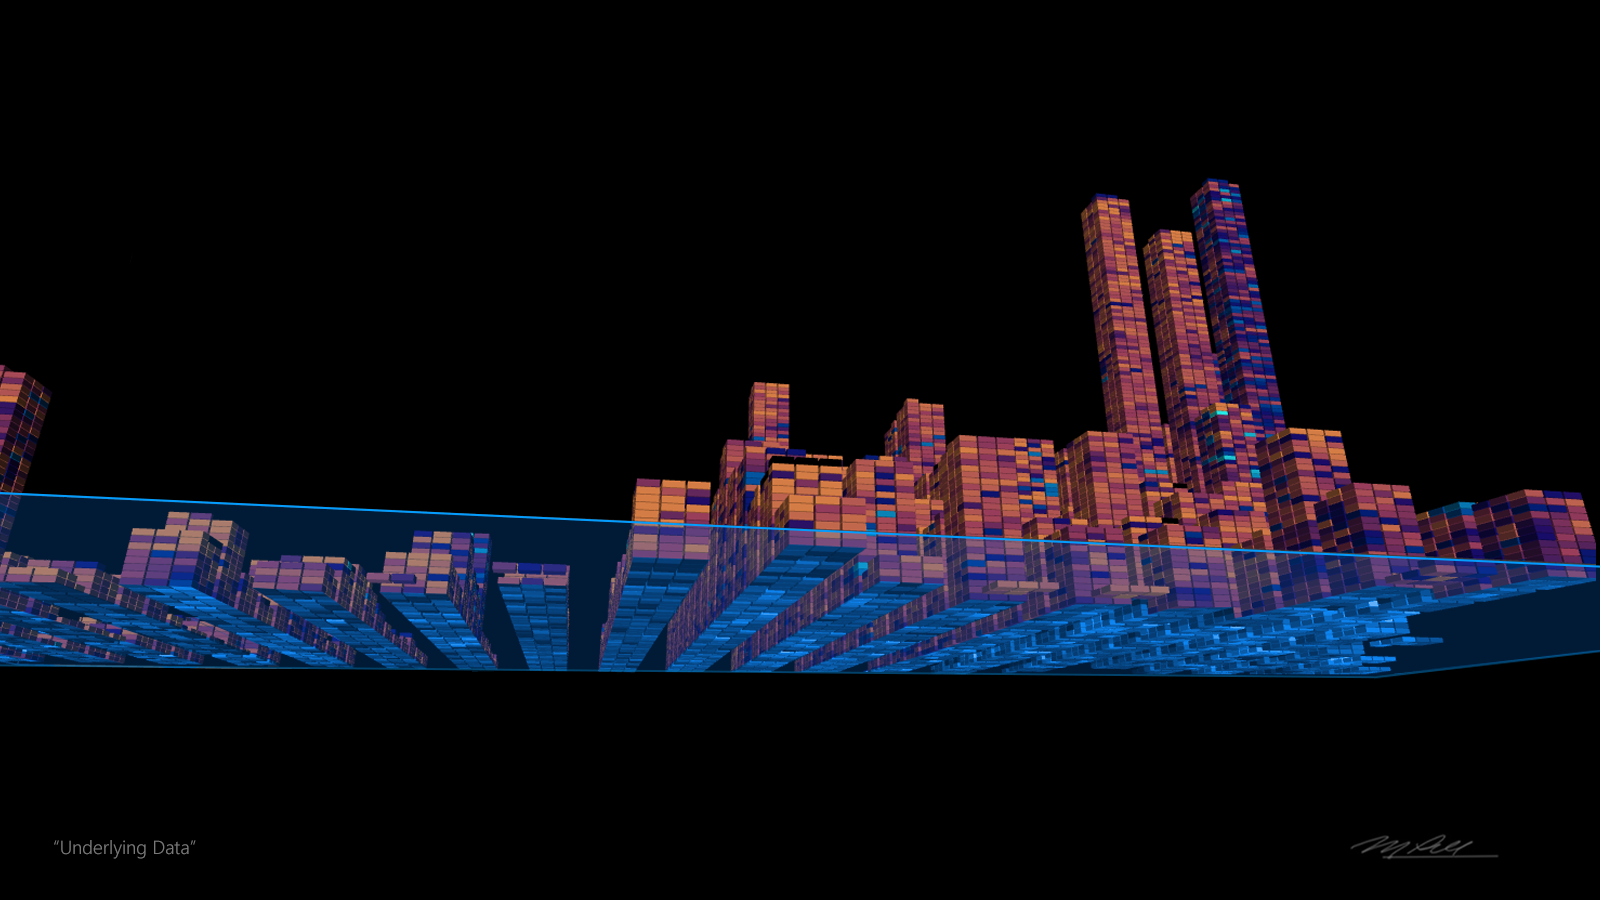
“Underlying Data”

“The United Cubes of America”

“The One Percent”

“The Emerald Data”
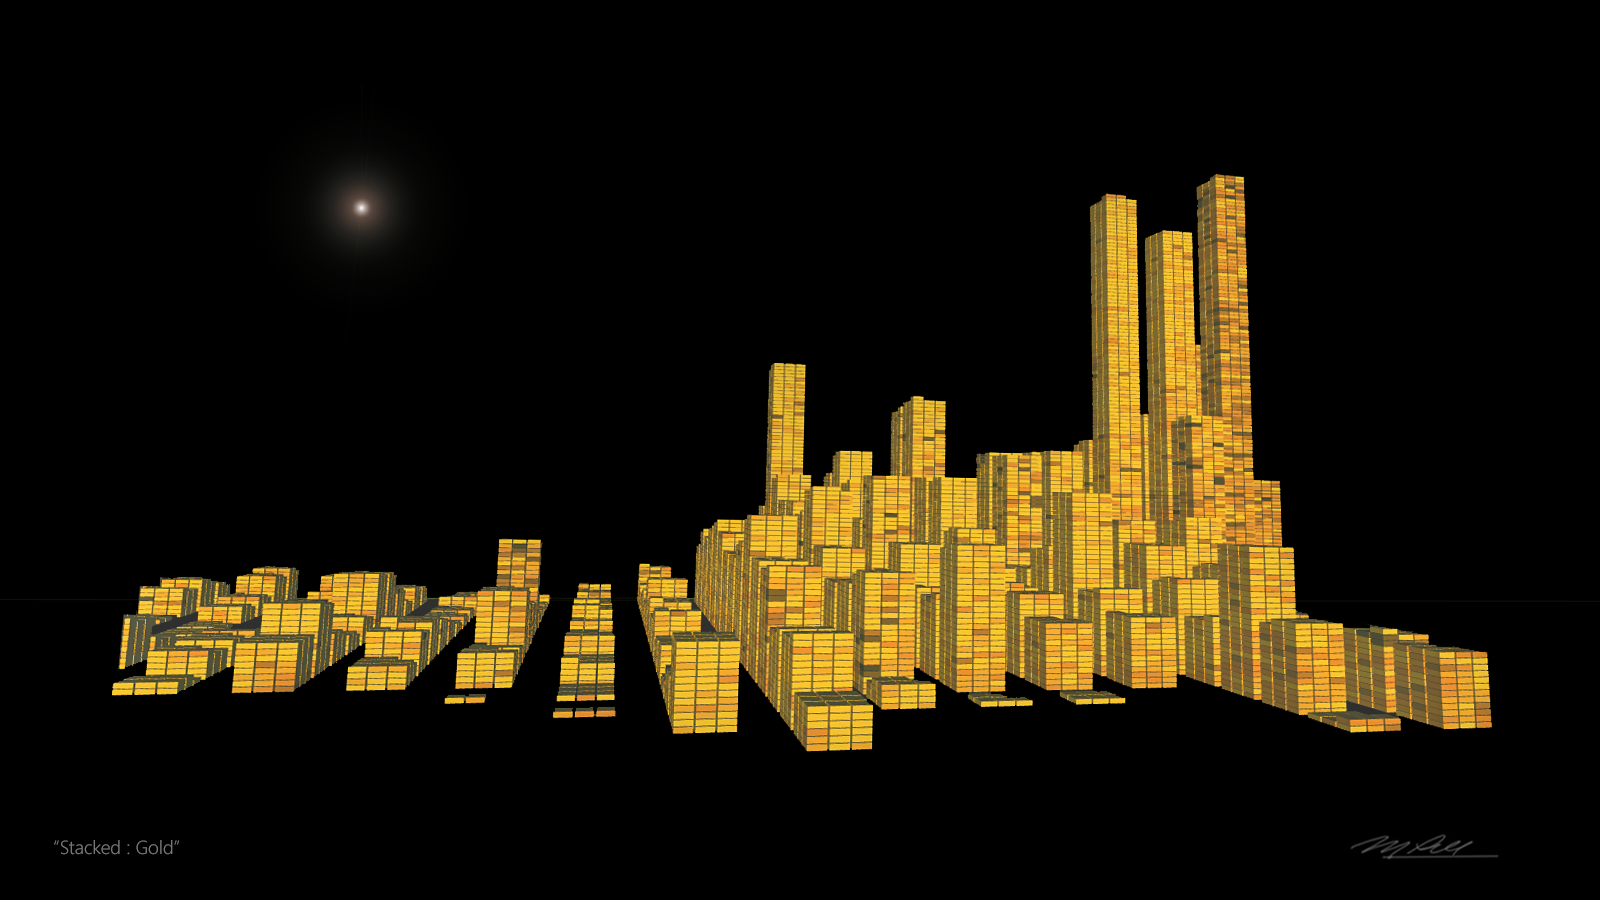
“Stacked Gold”
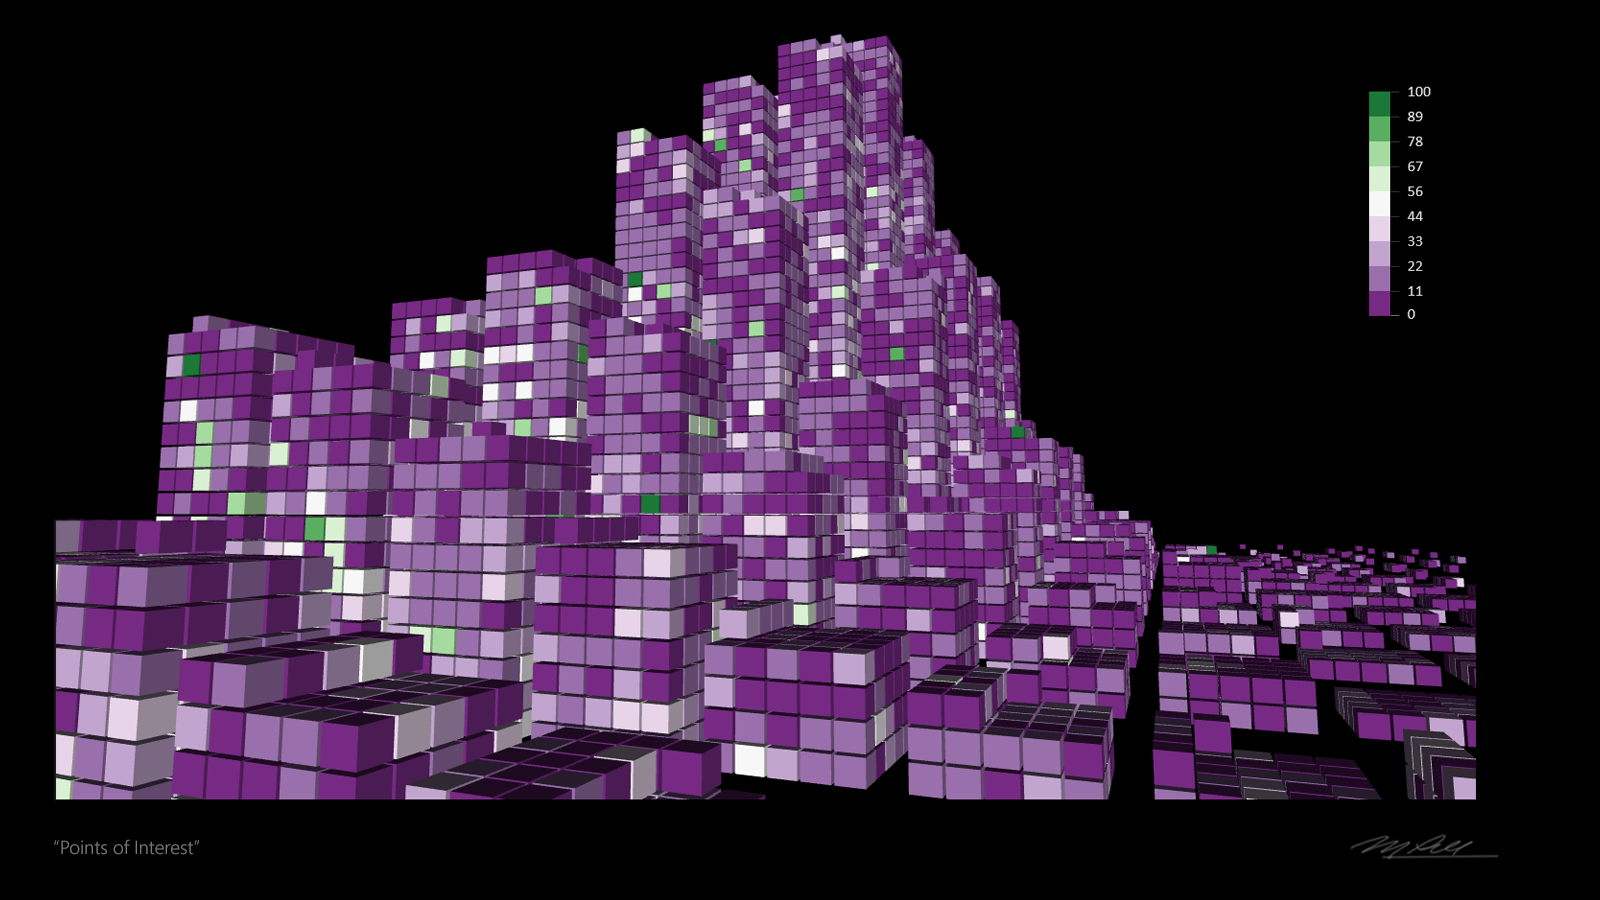
“Points of Interest”

“Low Income Data”
“Diablo Towers”

“Datacenter”
“Data Island”
“Data Blade”

“Data Array”

“The Outlier”
